Seeing as we're also doing a project at the moment about evacuation from major disasters we were interested in seeing what data we coudl find around Hurricane Harvey. It so happens that volunteers have been co-ordinating efforts at @HarveyRescue and have been collating the SOS reports from various sources, from which the media has been building maps such as those on the New York Times.
We were able to download the raw data from the @HarveyRescue site and bring it pretty quickly into Datascape. Unfortunately the first ~5000 or ~11000 record all showed the same date and time, so we couldn't use them for a space-time plot, but the remaining records were OK.
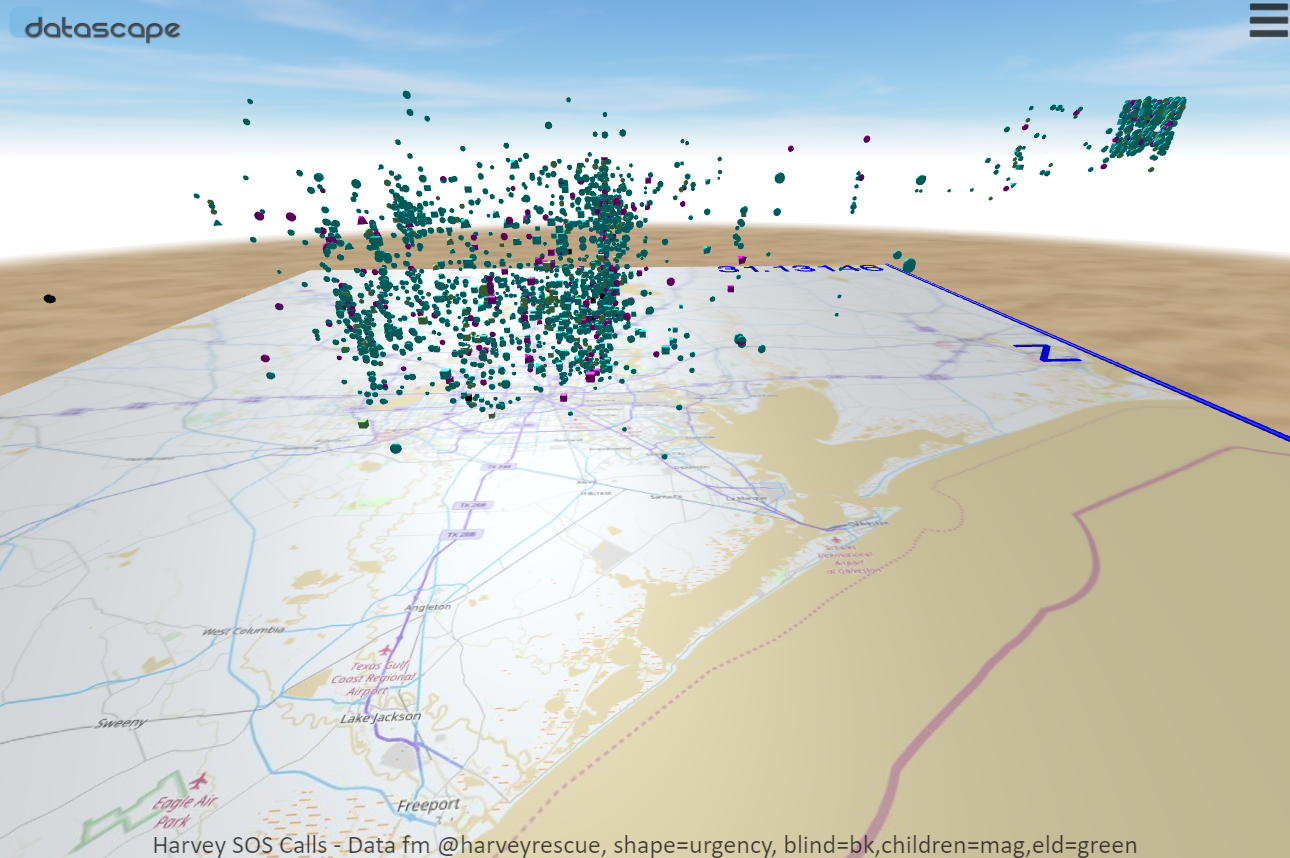
Our overview visualisation is shown above. You can launch it in WebGL in 3D in your own browser (and in mobile VR with Google Cardboard on your smartphone) by going to:
http://live.datascapevr.com/viewer/?wid=b051b24b-763e-421e-9c84-cbb26a976ff5
On the visualisation:
- Height is time, newest at the top
- Colour is:
- Cyan: Normal SOS
- Black: involves visually impaired people
- Magenta: involves children
- Green: involves elderly
- Shape is priority:
- Sphere = normal
- Tetraheden = semi-urgent
- Cube = urgent/emergency
- Size is # of people effected, roughly logarithmic
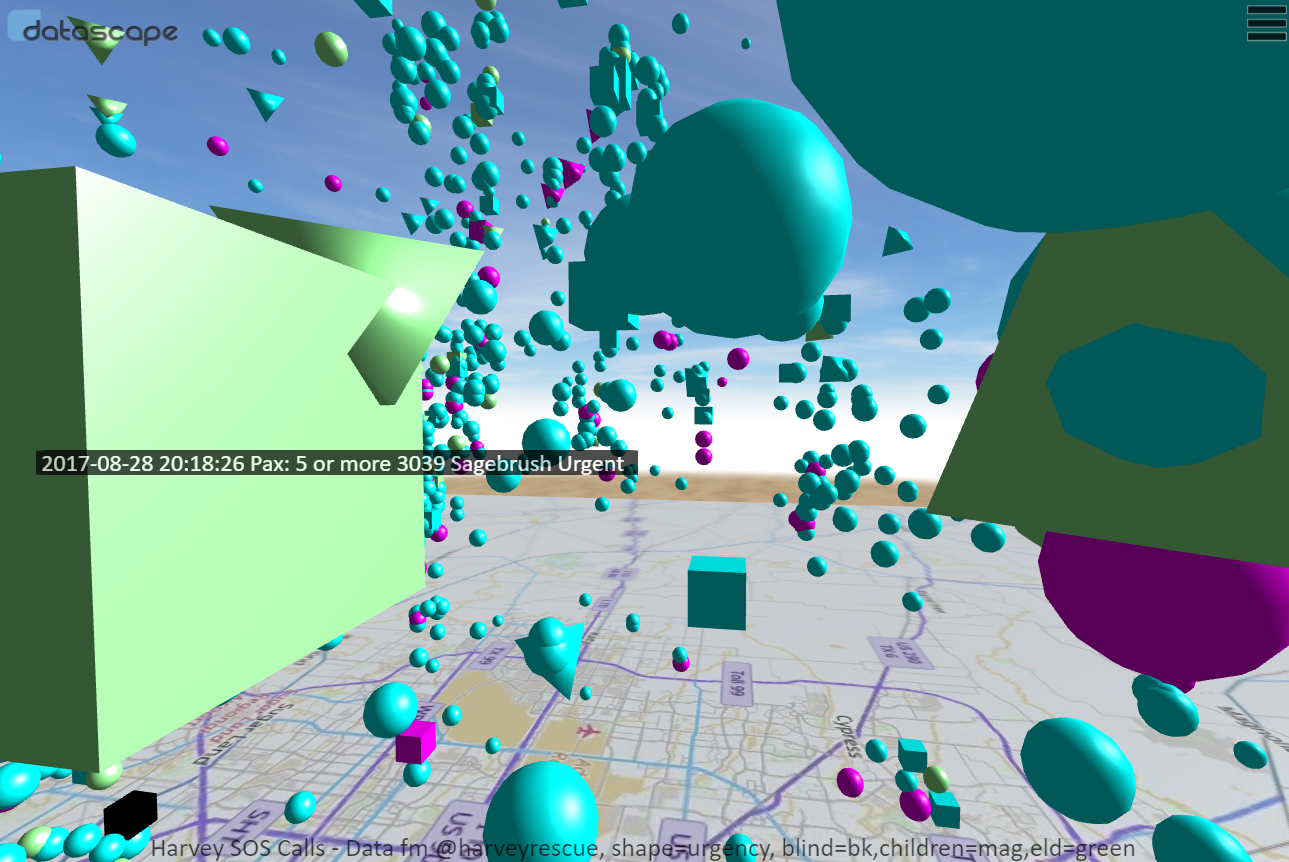
You can fly all around and through the data, and hover on a point to see the summary info. We've removed the more detailed information for privacy reasons.
It's a pity that we haven't got the early events data, but you can still see the time effects in a variety of places:
- The whole Port Arthur area kicks of way later than downtown Houston
- There is another time limited cluster around Kingwood, peaking around 9/10am on 29th
- And another lesser one around Baytown at 9/12am on 29th
- There is some evidence of an over-night lull in reporting, about 2am-6am
 |
| The Port Arthur cluster |
We're now looking at the Relief stage data and will hopefully get something up on that later in the week.
Don't forget to try the visualisation.
No comments:
Post a Comment